The goal of this lab was to geocode the locations of all frac sand mines in Wisconsin and compare the positional accuracy of the geocoded results to my classmates mine locations and a shapefile of actual mine locations.
Methods:
Geocoding using regular addresses
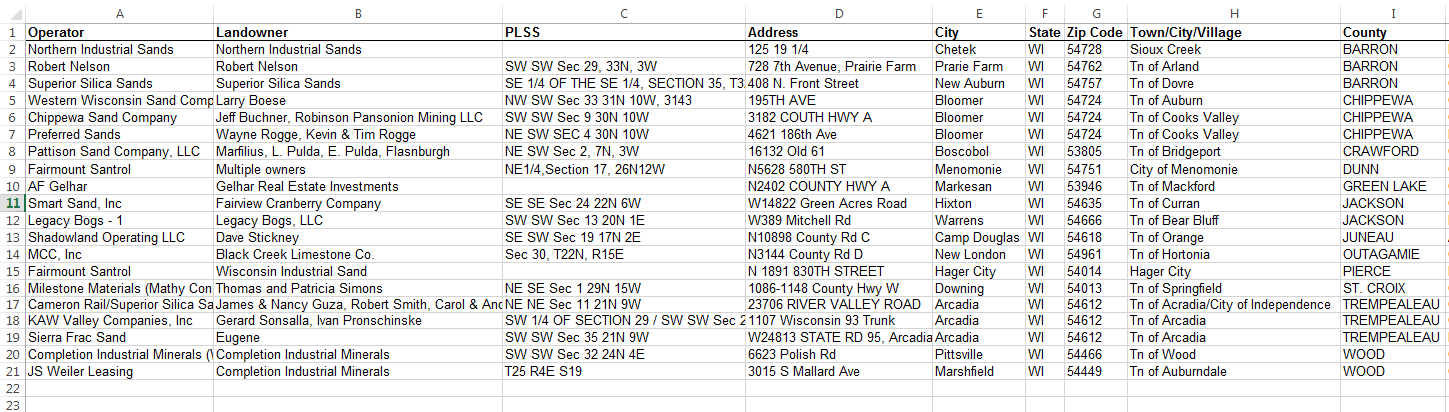
A table containing the addresses of all frac sand mines in Wisconsin was obtained from the Wisconsin DNR (Figure 1). Addresses from the table were then normalized to ensure they worked in the Interactive Rematch Inspector in ArcMap (Figure 2). Normalized fields included address, city, state, zip code, and other fields. After the normalized table had been created in Excel, the table was added into ArcMap. The normalized table was turned into a shapefile using the "World Geocode Service". Once the shapefile was created, the Interactive Rematch Inspector was used to check the positional accuracy of each frac sand mine address. Addresses that had an automatic match and regular street address were usually correct. Addresses that had an automatic match but only had a PLSS address were incorrect. The geocoder placed incorrect addresses in the center of the city. Incorrect or unmatched addresses were placed in the correct location using the Interactive Rematch Inspector. Mines were placed as close to the road network or the driveway of the address for the best positional accuracy.
Addresses were geocoded with regular addresses because the Interactive Rematch Inspector only works with regular addresses.
Manual geocoding using PLSS addresses
In order to ensure the best data accuracy for mine locations, Public Land Survey System (PLSS) addresses were used to check the accuracy of the geocoded addresses. PLSS is system that divides land based on units called sections. Sections are further divided into "townships", which are each 36 square miles. Township numbers are assigned to each location to determine how far north the location is of the Wisconsin-Illinois border, and range numbers are assigned to determine how many townships (6 miles wide) east or west the location is of the principal meridian (Univeristy of Wisconsin-Extension, 2000).
A feature class containing PLSS sections was added to the map to help with referencing PLSS addresses of mines to locations on the map. After manually locating each address with the PLSS, inaccurate addresses were placed in the correct location using the Interactive Rematch Inspector.
Addresses were manually goocoded with PLSS addresses because these addresses were usually accurate, and using both regular and PLSS addresses was a good way to double check the positional accuracy of the mine locations.
Comparing data
After I had geocoded all frac sand mine addresses, I compared the positional accuracy of my mine locations to my classmates' mines. To do this, all classmates' shapefiles were merged together using the "Merge" data analysis tool. Then I had to select classmates' data that had the same mines as me, using "Select By Attribute" command and searching with the Mine Unique ID field. The merged classmates mines and my mines were then compared using the "Near (Analysis)" tool, which calculated the distance between my mines and my classmates' mines. The tool created a distance field in the feature class containing my mines. The same comparison process was used to compare the positional accuracy of my mines to the actual mine locations, which were provided as a shapefile from our professor, Christina Hupy.
Results:
 |
| Figure 1: The above table was obtained from the Wisconsin DNR, and contained information about all frac sand mines in Wisconsin. The data was not normalized. |
 |
| Figure 2: A normalized Excel table was created for geocoding addresses for all frac sand mines in Wisconsin. |
 |
| Figure 3: The map shows the frac sand mines I geocoded using the data from the WIDNR. |
 |
| Figure 4: The map shows the locations of my mines in comparison to the same mines that were geocoded by other classmates. |
 |
| Figure 5: The table shows the distances between my mines and my classmates' mines. Larger distances indicate larger discrepancies between the two data sets, which indicates error in one or both of the data sets. |
 |
| Figure 6: The map shows the locations of my mines in comparison to the actual mine locations, provided by our professor Christina Hupy. |
 |
| Figure 7: The table shows the distances between my mines and the actual mine locations. Larger distances indicate larger discrepancies between the two data sets, which indicates error in my data. |
Discussion:
As shown by the distance tables (Figures 5 and 7), there were errors in my data and my classmates' data when compared to the correct mine locations. Half of my data agreed very well with my classmates' data because identical mines were within 30 meters of each other (Figure 5). My data did not agree as well with the actual mine locations because they were usually off by hundreds of meters, which still isn't too bad (Figure 7). I do not really know how to explain why my mines were this far off. These errors were most likely gross errors caused by myself. Gross errors are simple mistakes made by a user. There were also inherent and operational errors in my classmates' and my data. Inherent errors are errors that already exist with the data. For example, classmates all had different projections for their data, which did not agree with my data. This projection problem was inherent with the classmate's data. Another example of an inherent error in the class data was the attributes for the mines were not input the same into each classmates normalized table. Some people had the mines specific ID in a field called Mine Unique ID, while others had the ID in a field called Mine ID. Operational errors that existed in the data resulted from user error. For example, some of my classmate's mine locations and my mine locations were just plain off. This was a result of error on both of our behalves, and created large distances between the actual mine location and our mine locations. In order to know which mine location points are correct, you must use only the points that match closely with the actual mine locations data. A close match will have a small distance number.
Conclusion:
Overall, this lab was eye-opening because it showed me the difficulties that come from working with other people's data. Working with data from the WIDNR was slightly tricky, since I had to separate the data into different columns. Geocoding with these addresses was also hard because some of the addresses were completely wrong. I had to place the mines in the correct location (to the best of my knowledge) many times. Working with classmates' data was another challenge. The data did not want to merge at first, but it worked after I deleted fields except for the x,y, and Unique Mine ID fields. Then I had to select classmates' data that had the same mines as me. Overall, the geocoding and comparison processes were very time consuming, but educational. Experience with geocoding and working with foriegn datasets will benefit my future career in the geospatial workforce.
Reference List:
Univeristy of Wisconsin-Extension. (2000). Wisconsin Geological & Natural History Survey [pdf]. Retrieved from: http://wgnhs.uwex.edu/pubs/es0442002/
No comments:
Post a Comment